# List the packages readers will need
library(tidyverse)
# Add other packagesA brief, engaging description of your post (appears in previews and social sharing). Keep it under 2-3 sentences.
1 Introduction
Brief introduction that:
- Hooks the reader with an interesting problem or observation
- States the purpose of your analysis/tutorial
- Outlines what readers will learn or gain
2 Required Packages and Setup
Brief explanation of why these packages were chosen and any setup requirements.
3 The Problem/Data
# Data loading and initial preparation
# Load sample dataset
data <- mtcars
glimpse(data)
Rows: 32
Columns: 11
$ mpg <dbl> 21.0, 21.0, 22.8, 21.4, 18.7, 18.1, 14.3, 24.4, 22.8, 19.2, 17.8,…
$ cyl <dbl> 6, 6, 4, 6, 8, 6, 8, 4, 4, 6, 6, 8, 8, 8, 8, 8, 8, 4, 4, 4, 4, 8,…
$ disp <dbl> 160.0, 160.0, 108.0, 258.0, 360.0, 225.0, 360.0, 146.7, 140.8, 16…
$ hp <dbl> 110, 110, 93, 110, 175, 105, 245, 62, 95, 123, 123, 180, 180, 180…
$ drat <dbl> 3.90, 3.90, 3.85, 3.08, 3.15, 2.76, 3.21, 3.69, 3.92, 3.92, 3.92,…
$ wt <dbl> 2.620, 2.875, 2.320, 3.215, 3.440, 3.460, 3.570, 3.190, 3.150, 3.…
$ qsec <dbl> 16.46, 17.02, 18.61, 19.44, 17.02, 20.22, 15.84, 20.00, 22.90, 18…
$ vs <dbl> 0, 0, 1, 1, 0, 1, 0, 1, 1, 1, 1, 0, 0, 0, 0, 0, 0, 1, 1, 1, 1, 0,…
$ am <dbl> 1, 1, 1, 0, 0, 0, 0, 0, 0, 0, 0, 0, 0, 0, 0, 0, 0, 1, 1, 1, 0, 0,…
$ gear <dbl> 4, 4, 4, 3, 3, 3, 3, 4, 4, 4, 4, 3, 3, 3, 3, 3, 3, 4, 4, 4, 3, 3,…
$ carb <dbl> 4, 4, 1, 1, 2, 1, 4, 2, 2, 4, 4, 3, 3, 3, 4, 4, 4, 1, 2, 1, 1, 2,…- Describe your data source
- Explain the problem you’re addressing
- Share any initial data preparation steps
4 Analysis/Tutorial Steps
4.1 Step 1: Initial Data Exploration
# Your analysis code here
glimpse(mtcars)
Rows: 32
Columns: 11
$ mpg <dbl> 21.0, 21.0, 22.8, 21.4, 18.7, 18.1, 14.3, 24.4, 22.8, 19.2, 17.8,…
$ cyl <dbl> 6, 6, 4, 6, 8, 6, 8, 4, 4, 6, 6, 8, 8, 8, 8, 8, 8, 4, 4, 4, 4, 8,…
$ disp <dbl> 160.0, 160.0, 108.0, 258.0, 360.0, 225.0, 360.0, 146.7, 140.8, 16…
$ hp <dbl> 110, 110, 93, 110, 175, 105, 245, 62, 95, 123, 123, 180, 180, 180…
$ drat <dbl> 3.90, 3.90, 3.85, 3.08, 3.15, 2.76, 3.21, 3.69, 3.92, 3.92, 3.92,…
$ wt <dbl> 2.620, 2.875, 2.320, 3.215, 3.440, 3.460, 3.570, 3.190, 3.150, 3.…
$ qsec <dbl> 16.46, 17.02, 18.61, 19.44, 17.02, 20.22, 15.84, 20.00, 22.90, 18…
$ vs <dbl> 0, 0, 1, 1, 0, 1, 0, 1, 1, 1, 1, 0, 0, 0, 0, 0, 0, 1, 1, 1, 1, 0,…
$ am <dbl> 1, 1, 1, 0, 0, 0, 0, 0, 0, 0, 0, 0, 0, 0, 0, 0, 0, 1, 1, 1, 0, 0,…
$ gear <dbl> 4, 4, 4, 3, 3, 3, 3, 4, 4, 4, 4, 3, 3, 3, 3, 3, 3, 4, 4, 4, 3, 3,…
$ carb <dbl> 4, 4, 1, 1, 2, 1, 4, 2, 2, 4, 4, 3, 3, 3, 4, 4, 4, 1, 2, 1, 1, 2,…ggplot(mtcars, aes(x=cyl, y=mpg)) +
geom_point()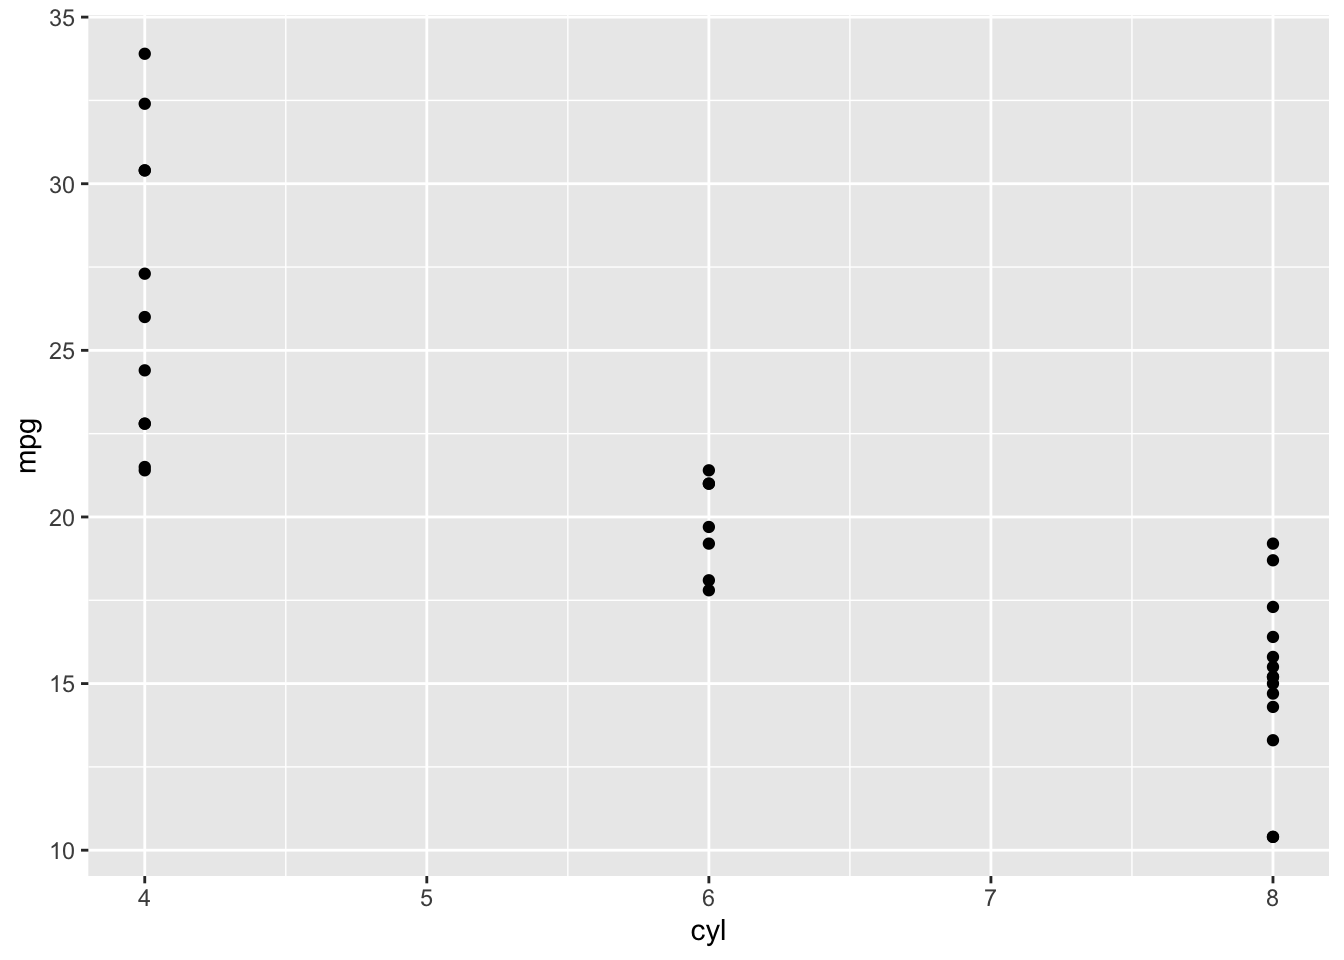
# Your visualizationExplain what you found and why it’s interesting.
4.2 Step 2: Main Analysis
# Core analysis codeWalk through your analysis, explaining: - Why you chose this approach - What the code does - What the results mean
4.3 Step 3: Results and Visualization
# Create compelling visualizationsInterpret your results and explain their significance.
5 Key Takeaways
- Bullet point summary of main findings
- Practical applications
- Important insights
6 Reproducibility
# Print session info for reproducibility
sessionInfo()
R version 4.5.0 (2025-04-11)
Platform: aarch64-apple-darwin20
Running under: macOS Sequoia 15.5
Matrix products: default
BLAS: /Library/Frameworks/R.framework/Versions/4.5-arm64/Resources/lib/libRblas.0.dylib
LAPACK: /Library/Frameworks/R.framework/Versions/4.5-arm64/Resources/lib/libRlapack.dylib; LAPACK version 3.12.1
locale:
[1] en_US.UTF-8/en_US.UTF-8/en_US.UTF-8/C/en_US.UTF-8/en_US.UTF-8
time zone: America/Los_Angeles
tzcode source: internal
attached base packages:
[1] stats graphics grDevices utils datasets methods base
other attached packages:
[1] here_1.0.1 lubridate_1.9.4 forcats_1.0.0 stringr_1.5.1
[5] dplyr_1.1.4 purrr_1.0.4 readr_2.1.5 tidyr_1.3.1
[9] tibble_3.3.0 ggplot2_3.5.2 tidyverse_2.0.0
loaded via a namespace (and not attached):
[1] gtable_0.3.6 jsonlite_2.0.0 compiler_4.5.0 tidyselect_1.2.1
[5] scales_1.4.0 yaml_2.3.10 fastmap_1.2.0 R6_2.6.1
[9] labeling_0.4.3 generics_0.1.4 knitr_1.50 htmlwidgets_1.6.4
[13] rprojroot_2.0.4 pillar_1.10.2 RColorBrewer_1.1-3 tzdb_0.5.0
[17] rlang_1.1.6 stringi_1.8.7 xfun_0.52 timechange_0.3.0
[21] cli_3.6.5 withr_3.0.2 magrittr_2.0.3 digest_0.6.37
[25] grid_4.5.0 hms_1.1.3 lifecycle_1.0.4 vctrs_0.6.5
[29] evaluate_1.0.3 glue_1.8.0 farver_2.1.2 rmarkdown_2.29
[33] tools_4.5.0 pkgconfig_2.0.3 htmltools_0.5.8.1 7 Next Steps
- Suggest areas for further exploration
- Mention potential improvements
- Invite reader engagement
8 References
- Cite your sources
- Link to relevant documentation
- Credit other contributors
Reuse
Citation
BibTeX citation:
@online{(ryy)_glenn_thomas2024,
  author = {(Ryy) Glenn Thomas, Ronald and Name, Your},
  title = {Your {Technical} {Blog} {Post} {Title}},
  date = {2024-12-22},
  url = {https://focusonr.org/posts/setupquarto/quarto-blog-template.html},
  langid = {en}
}
For attribution, please cite this work as:
(Ryy) Glenn Thomas, Ronald, and Your Name. 2024. “Your Technical
Blog Post Title.” December 22, 2024. https://focusonr.org/posts/setupquarto/quarto-blog-template.html.